Exporting Data from the Data Admin System
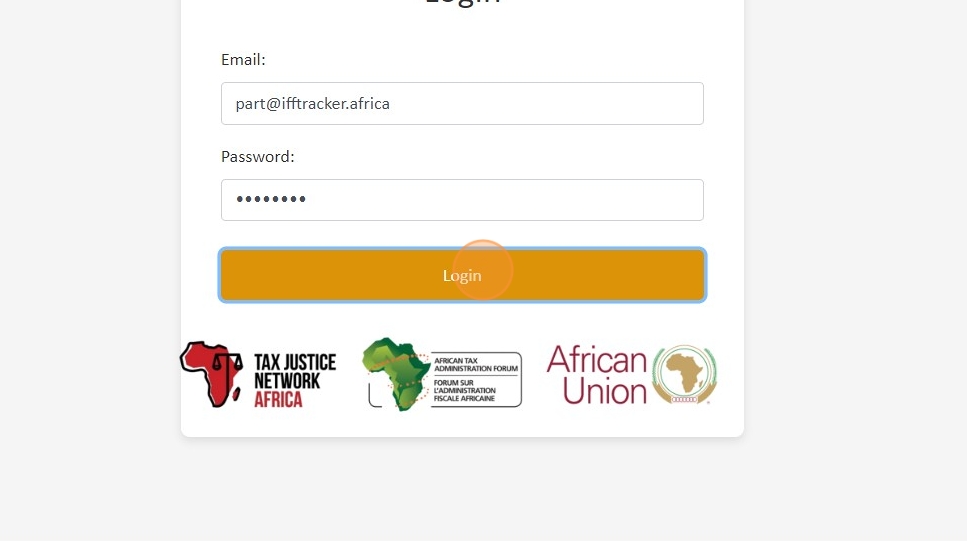
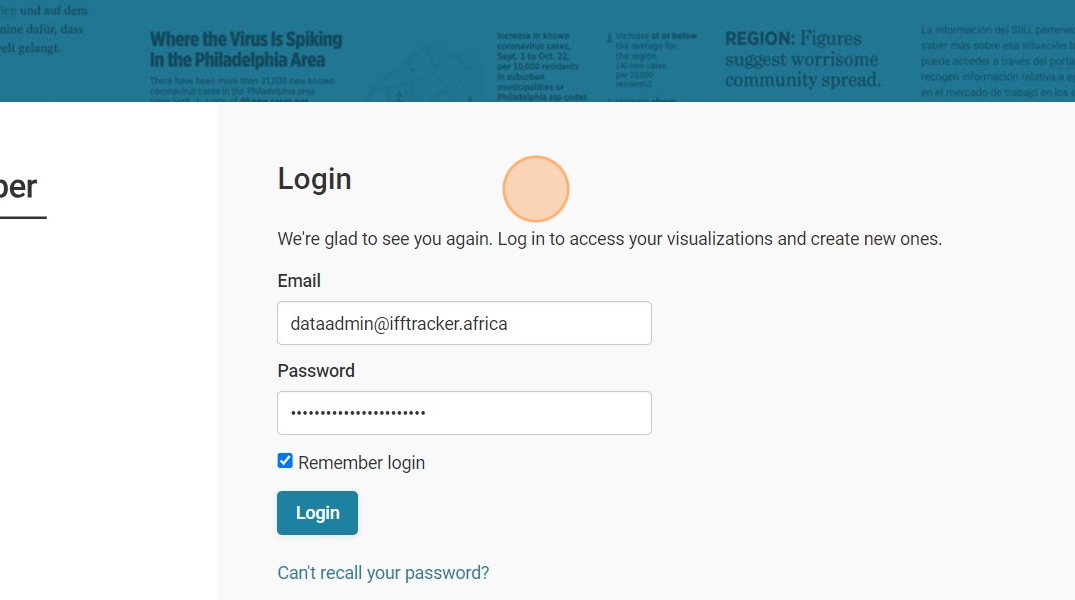
1. Navigate to the Data Admin Web App https://app.ifftracker.africa
2. Enter your credentials and click 'Login.'
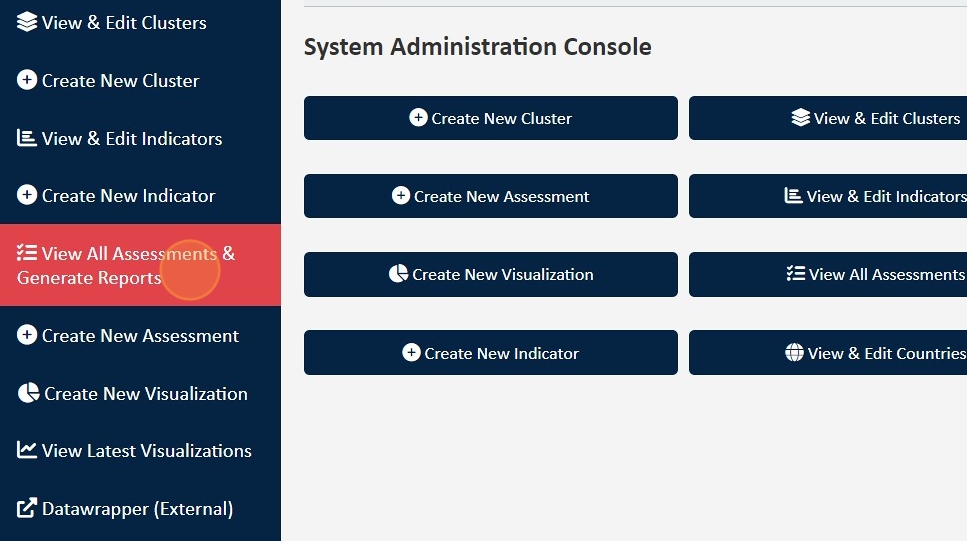
3. Then click "View All Assessments & Generate Reports"
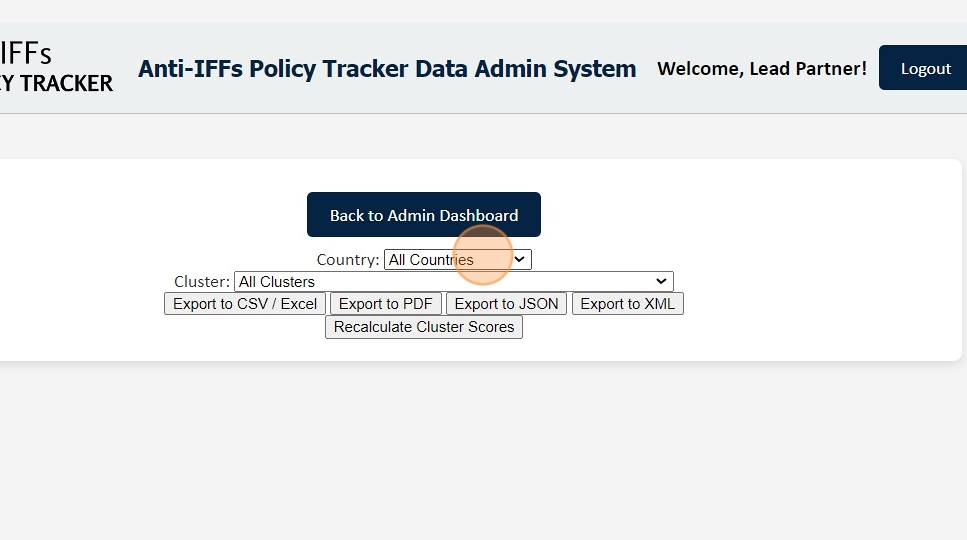
4. Select the desired data combinations to export, which can be filtered by options such as countries, clusters, and other relevant criteria.
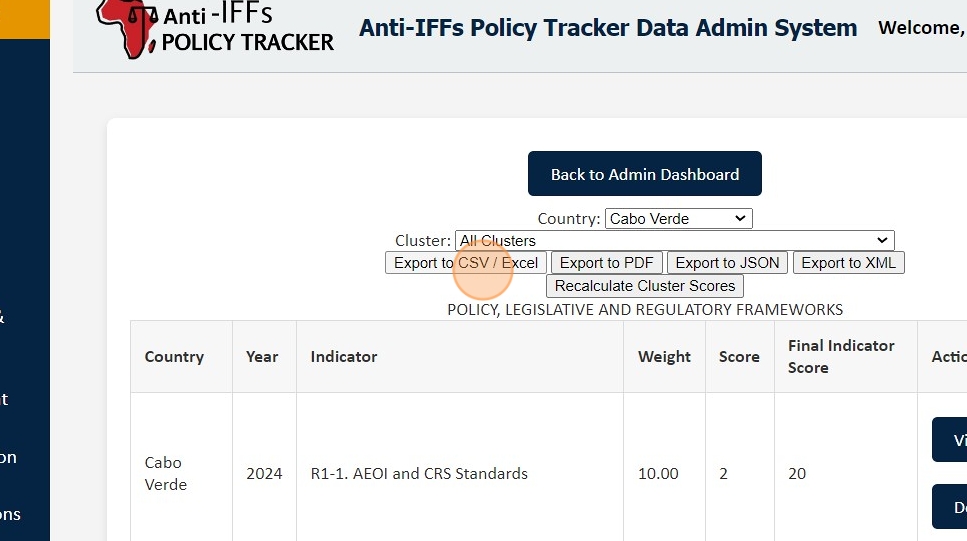
5. And then click 'Export to CSV / Excel.' A file containing the exported data will be downloaded. Keep this file on hand as it will be used in Datawrapper.
Creating Visualizations in Datawrapper
6. Switch to a new tab and head to 'Datawrapper' by visiting https://app.datawrapper.de/
7. Enter your Datawrapper credentials and click 'Login.'
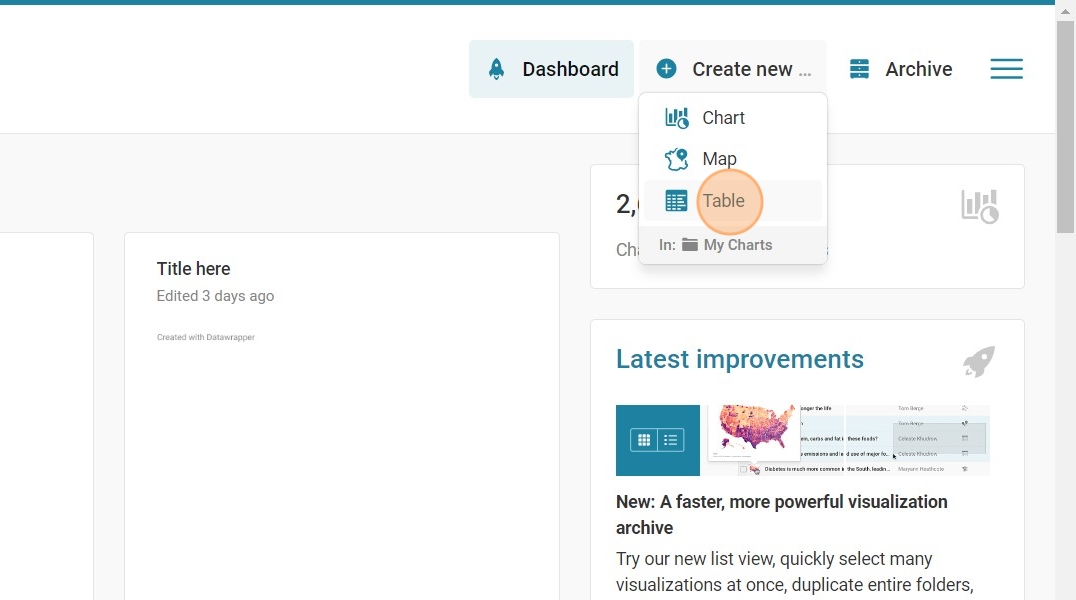
8. Once logged in, go to 'Create New' and then select 'Table.'
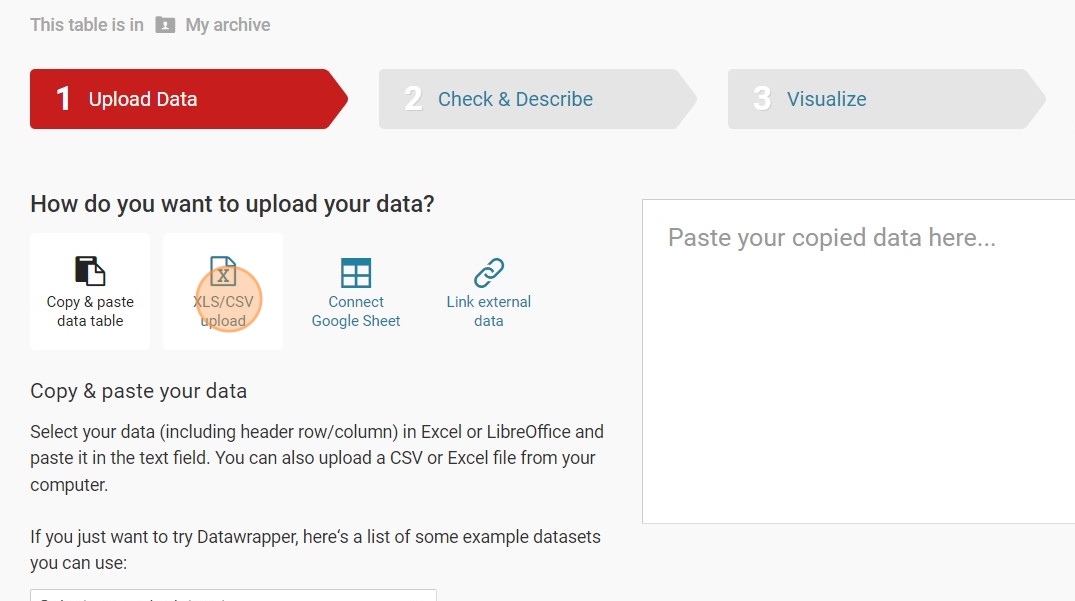
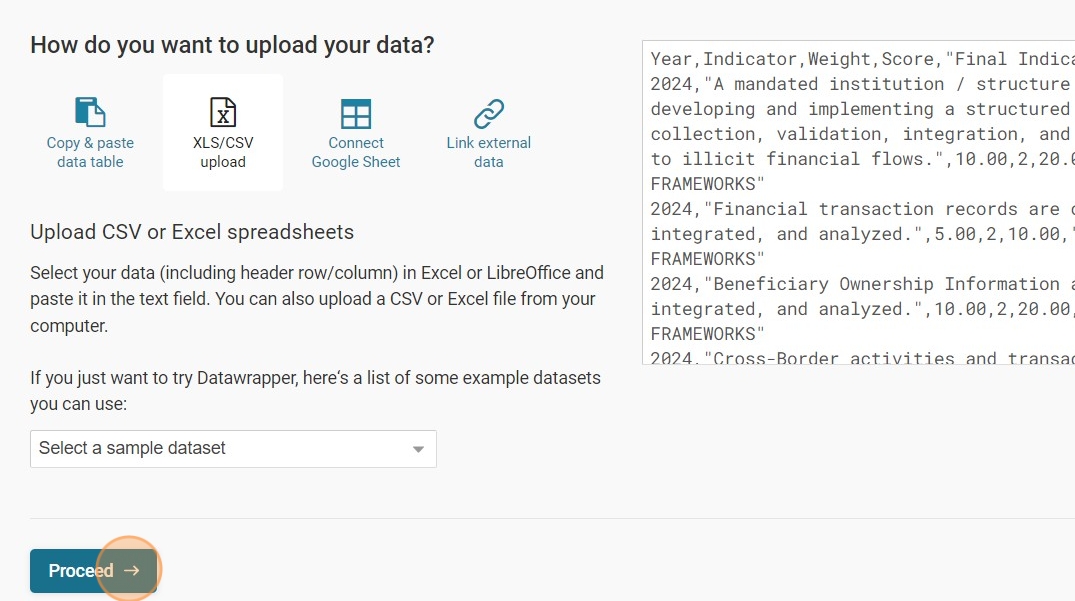
9. Then click 'XLS/CSV Upload' and select the file downloaded from the Data Admin in the previous step
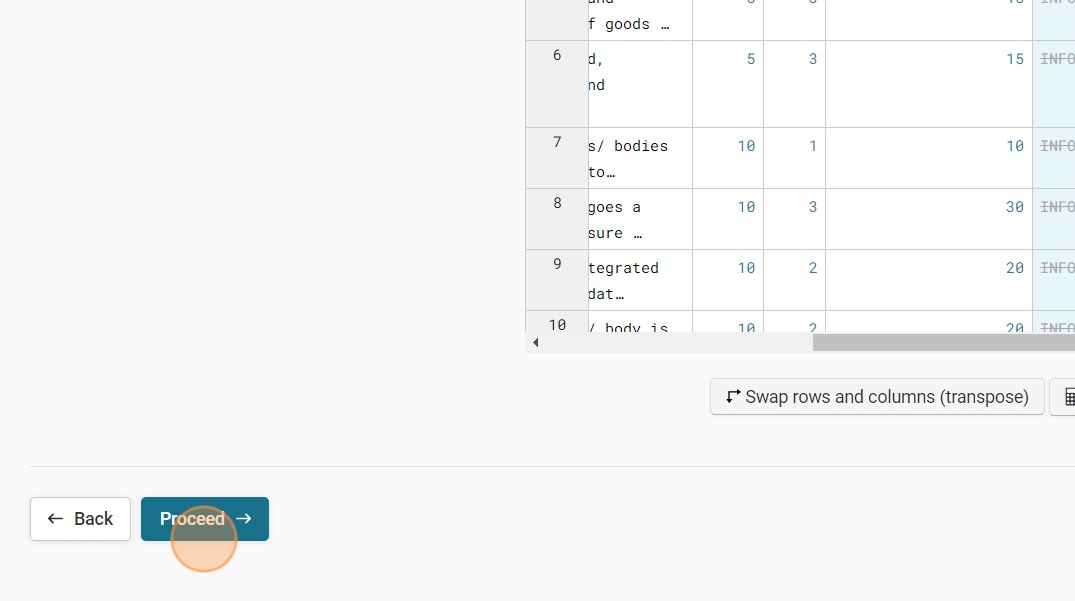
10. Load the file and click 'Proceed' to continue.
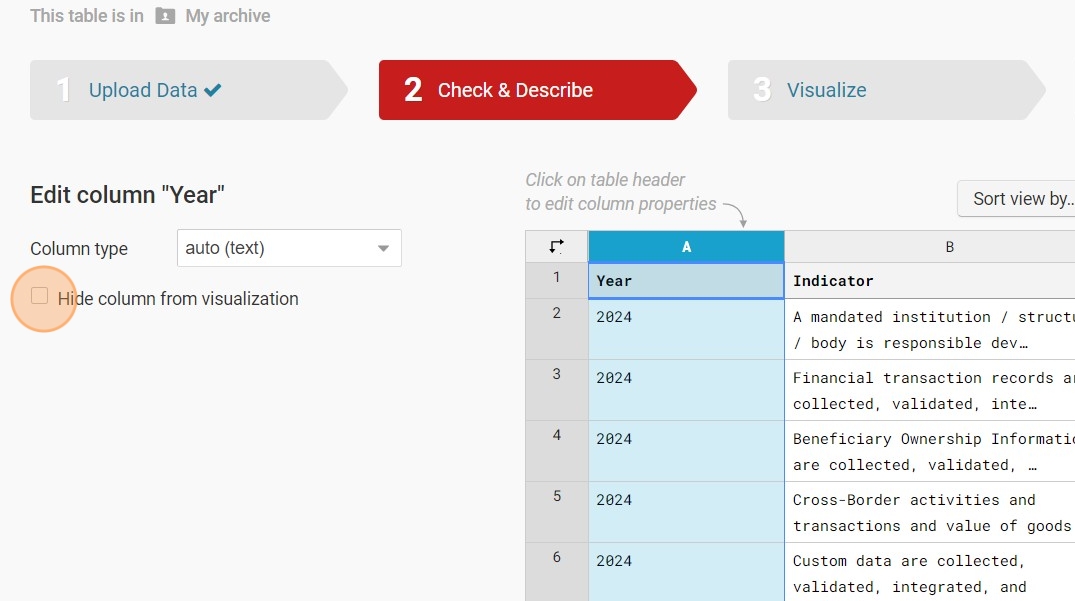
11. The data can be polished by hiding any data that is not needed for the visualization.
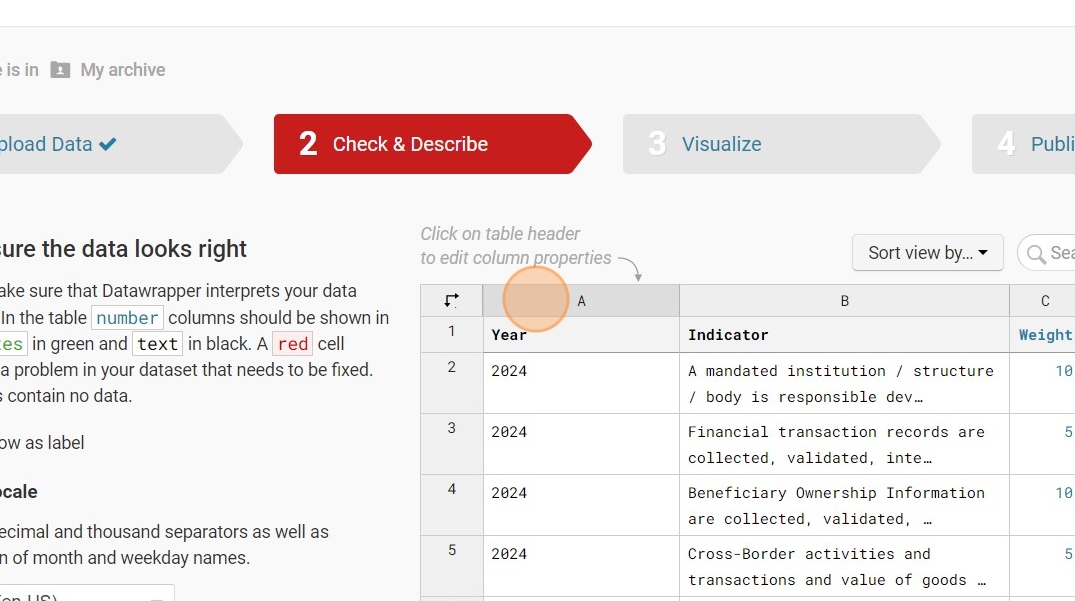
12. Click on the column you wish to hide, then select 'Hide Column from Visualization.'
13. and then click "Proceed"
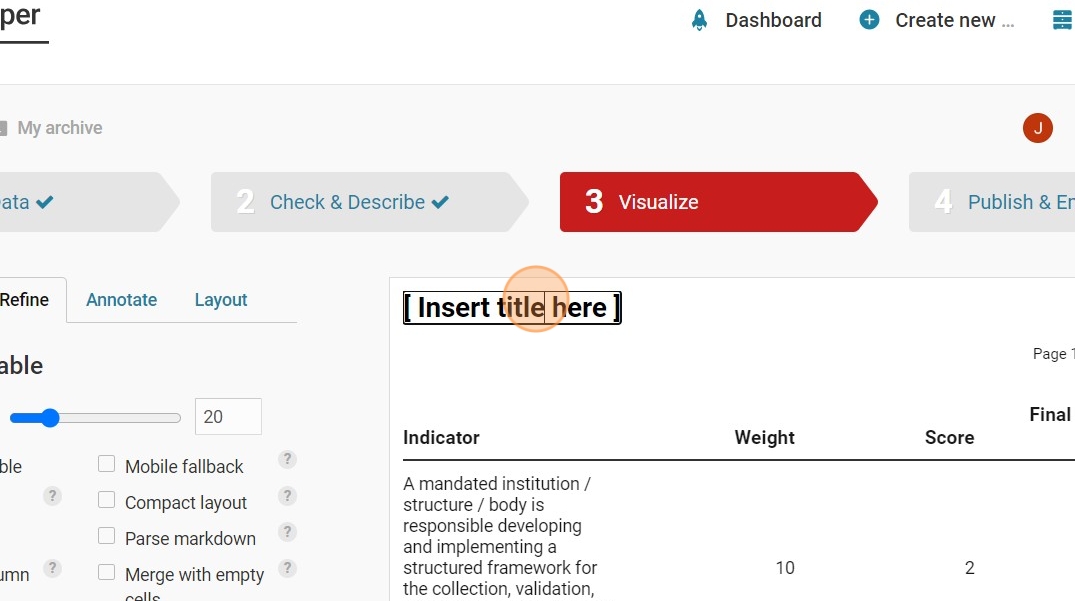
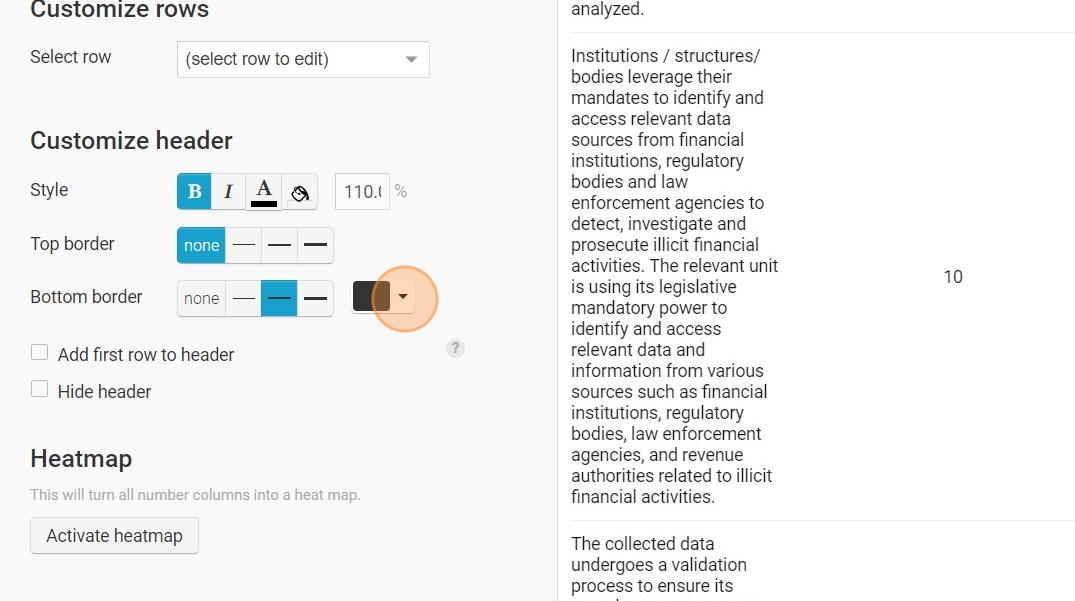
14. Type in the title you'd like to give to the visualization
15. Customize the display and appearance using the various customization tools available.
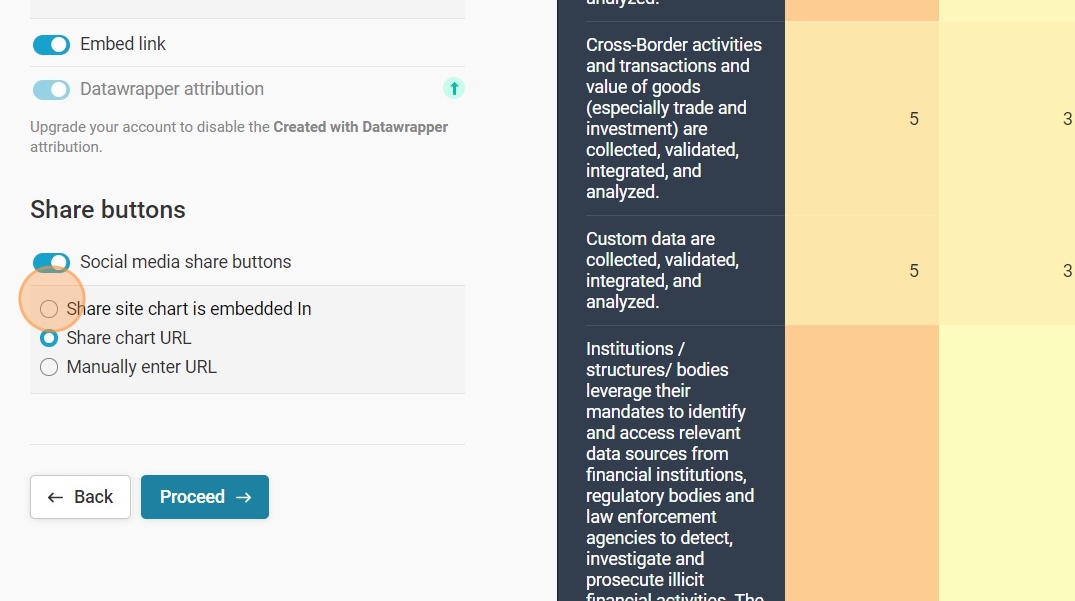
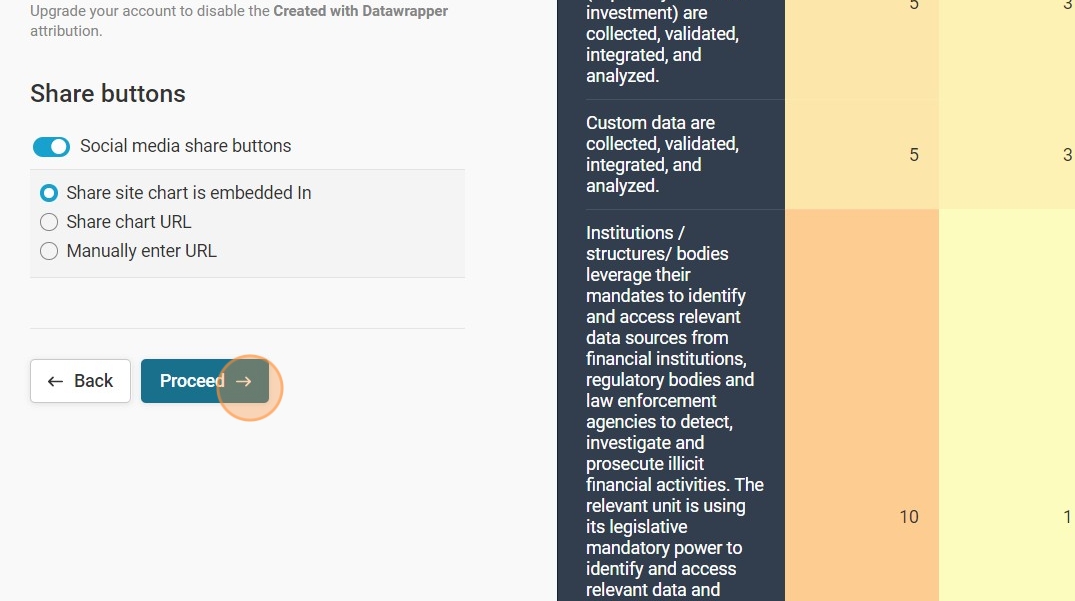
16. And set the social media sharing preferences. Selecting 'Share site chart is embedded in' is recommended to optimize traffic to the web site.
17. and then click "Proceed"
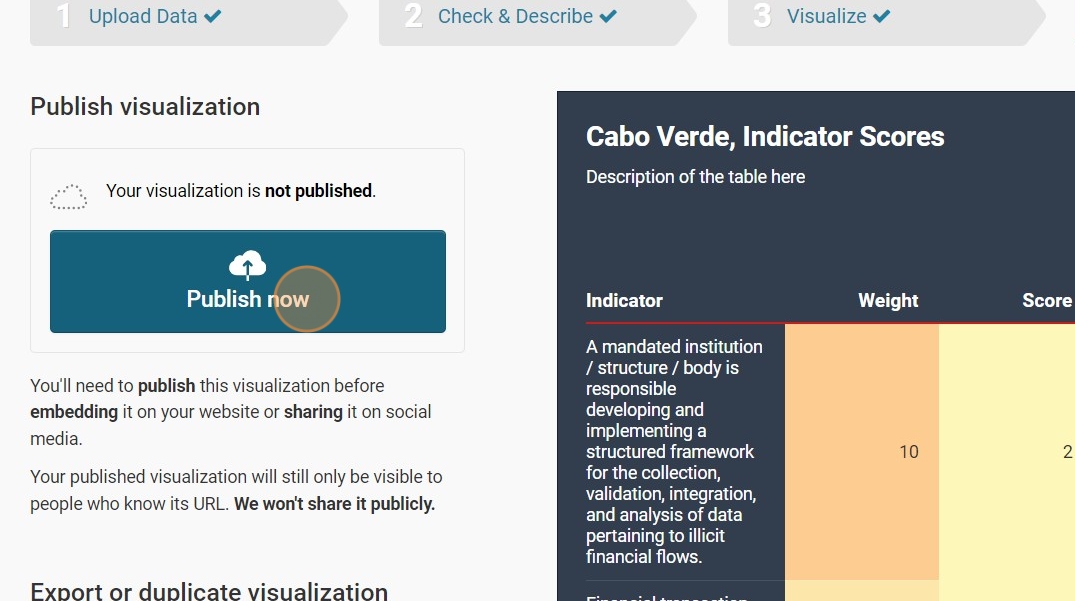
18. Then click 'Publish Now' to publish your visualization
Embedding the Visualization in Joomla
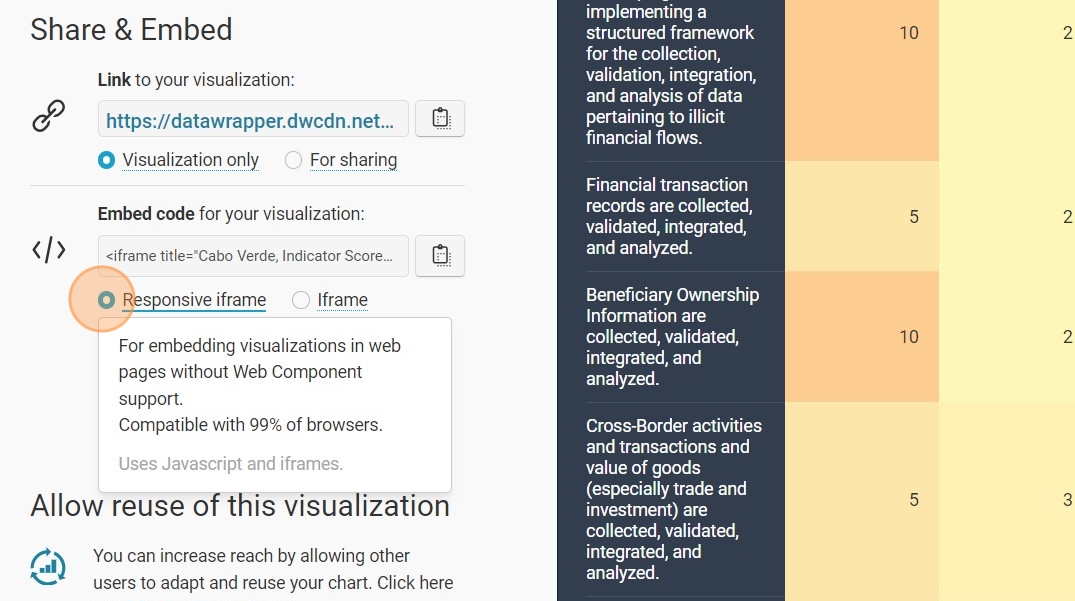
19. Once the visualization is published, go to the 'Share & Embed' section and select the 'iFrame' option. Copy the iFrame code and keep it for later use to display the visualization on your Joomla website.
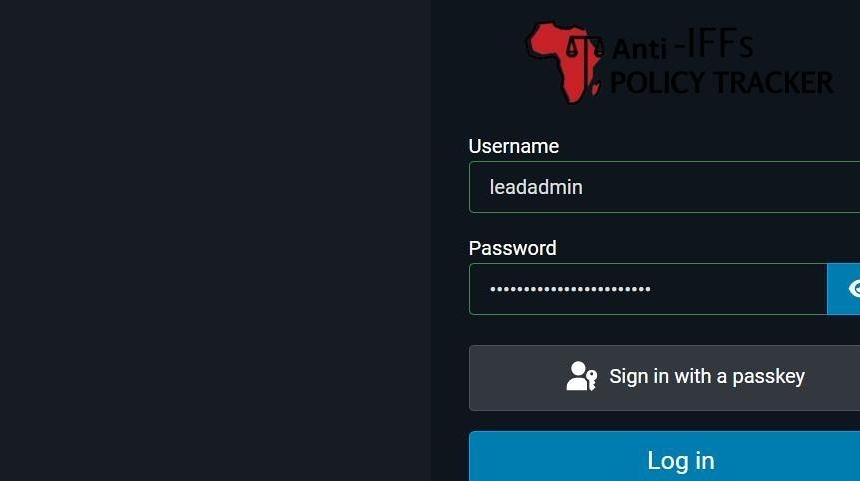
20. Now we switch to the Joomla Admin Portal via https://ifftracker.africa/administrator/ and login with our credentials
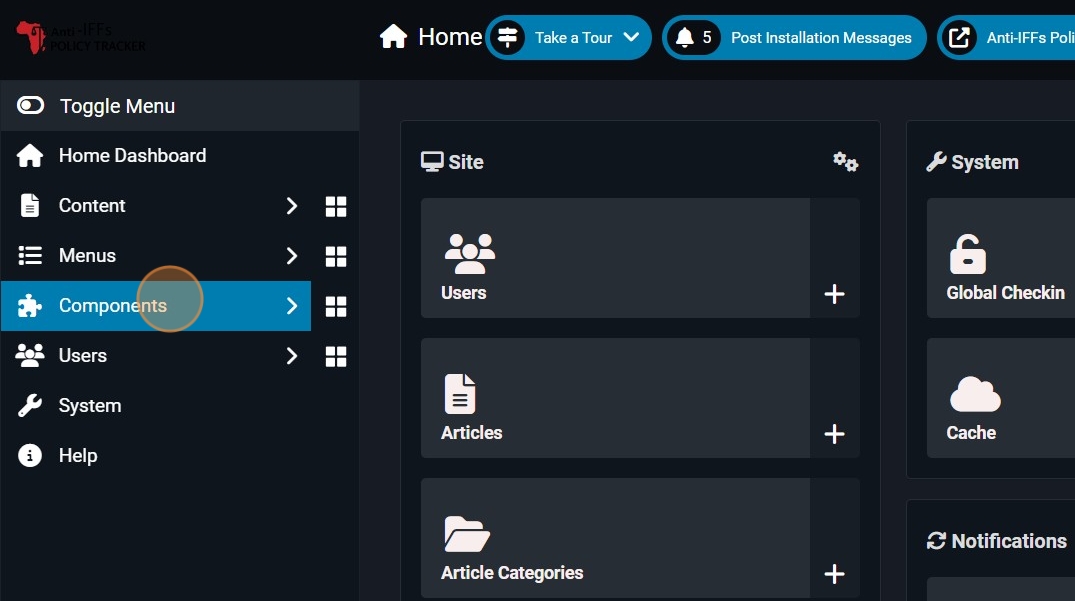
21. Once logged in to the Joomla admin panel, click 'Components.'
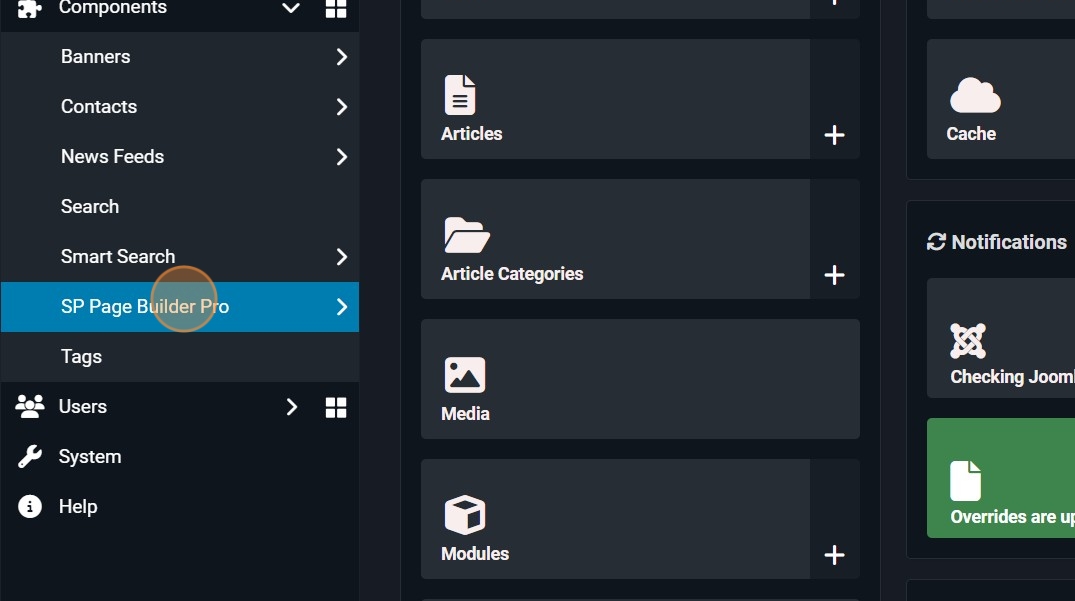
22. And then "SP Page Builder Pro"
23. and then "Pages"
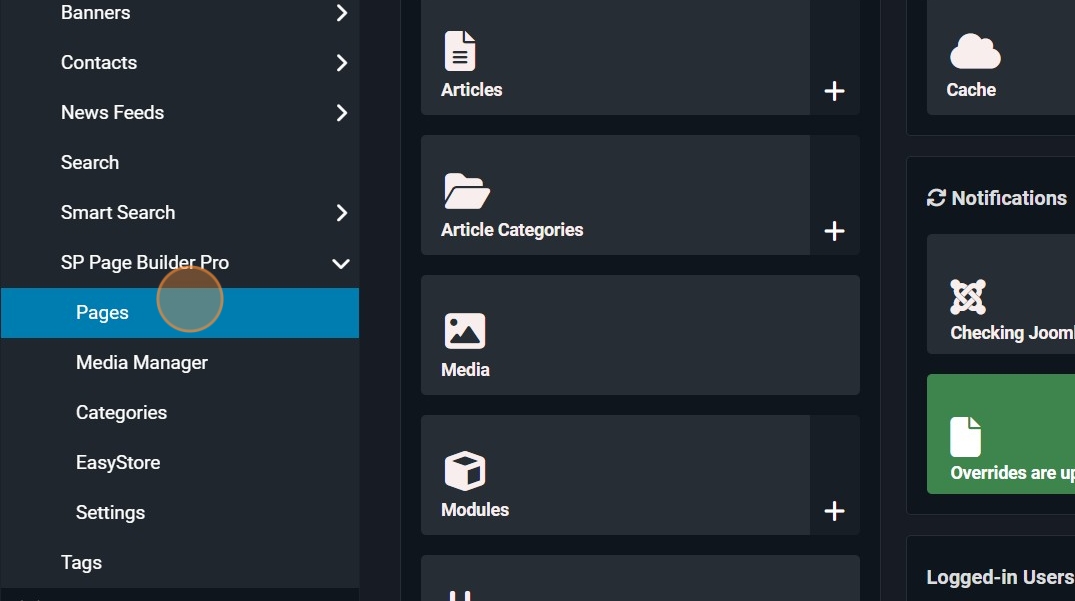
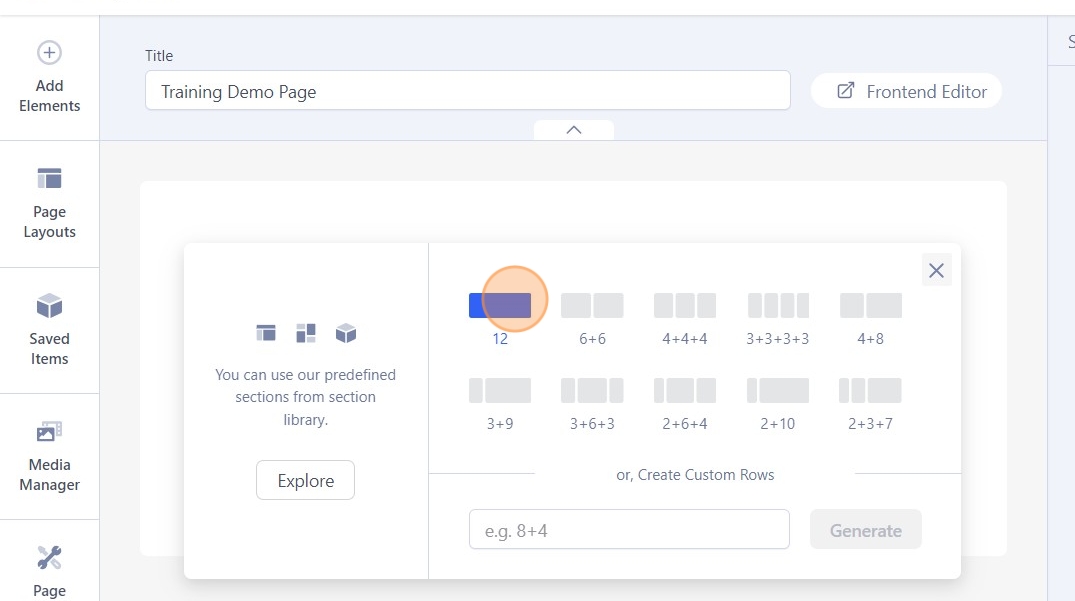
24. and then "Add New Page"
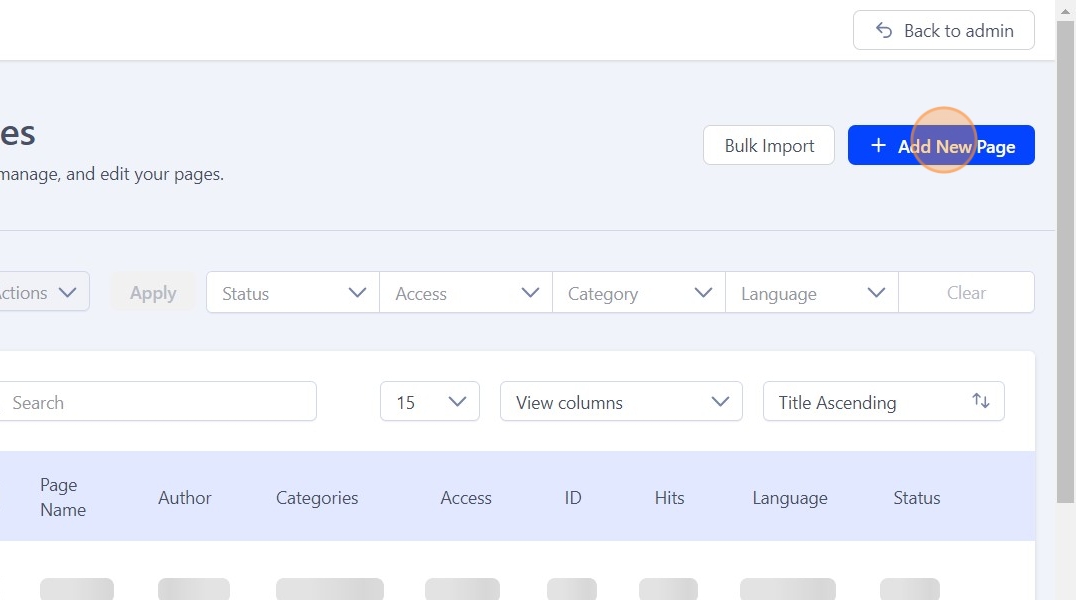
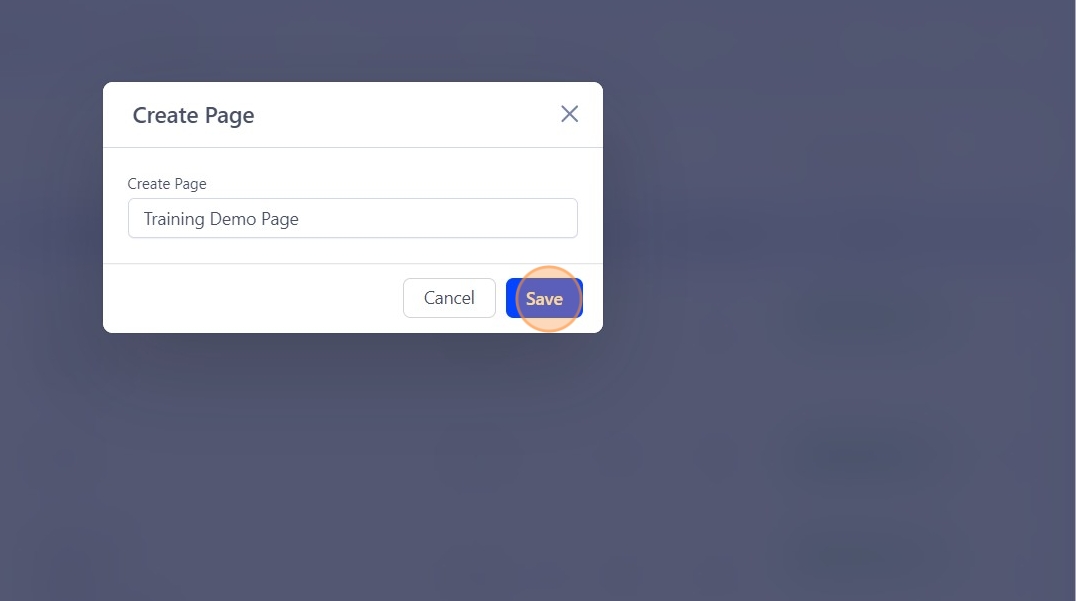
25. Enter the name of the page
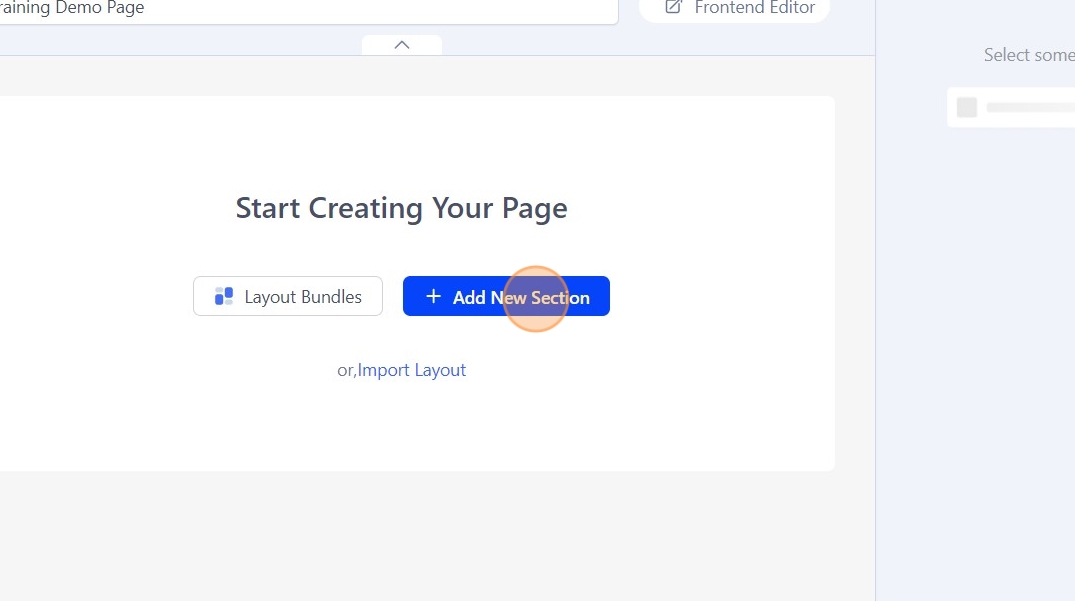
26. and then Click "Add New Section"
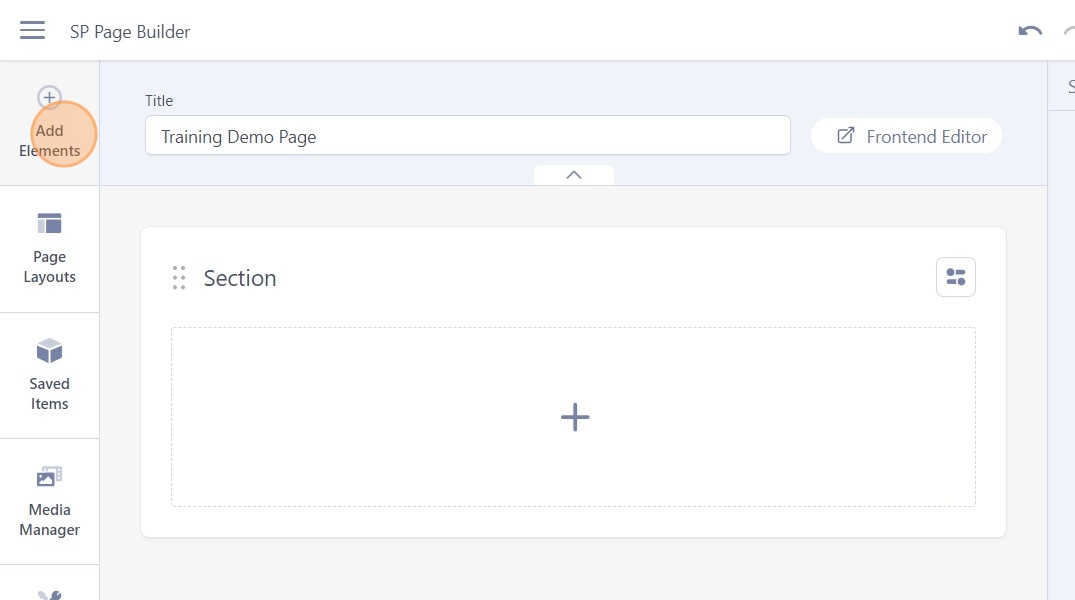
27. Click on the block
28. Click "Add Elements"
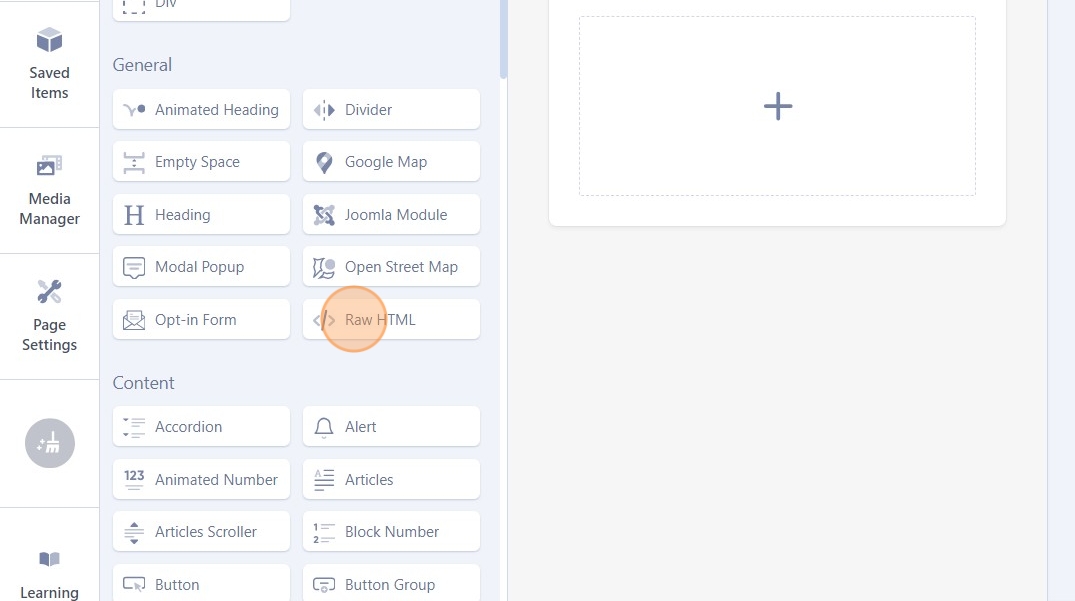
29. and then click "Raw HTML"
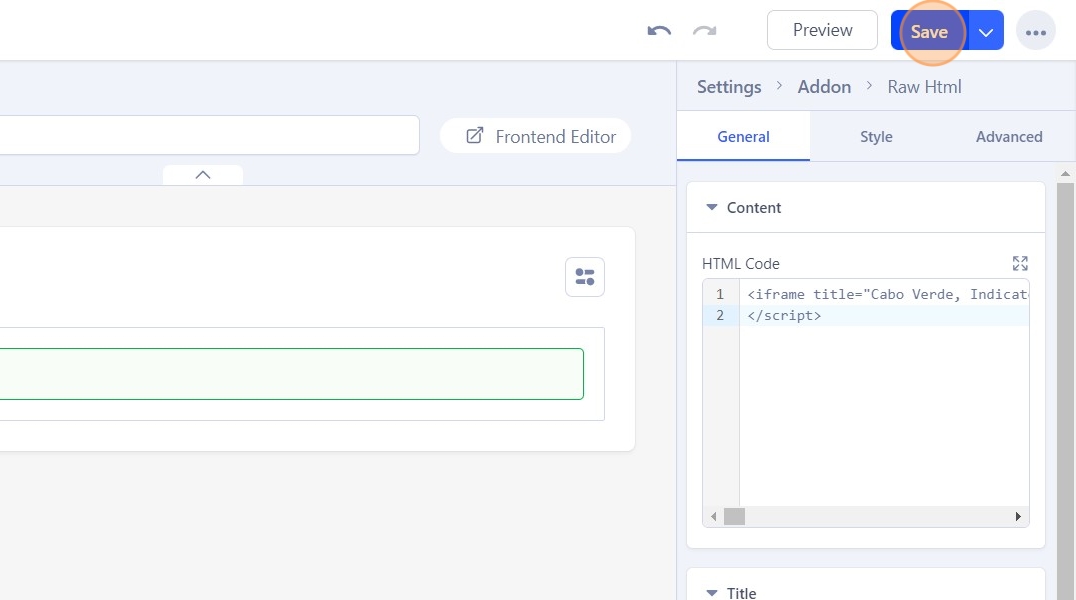
30. And then paste the visualization's embedded HTML code, copied from Datawrapper in the previous step.
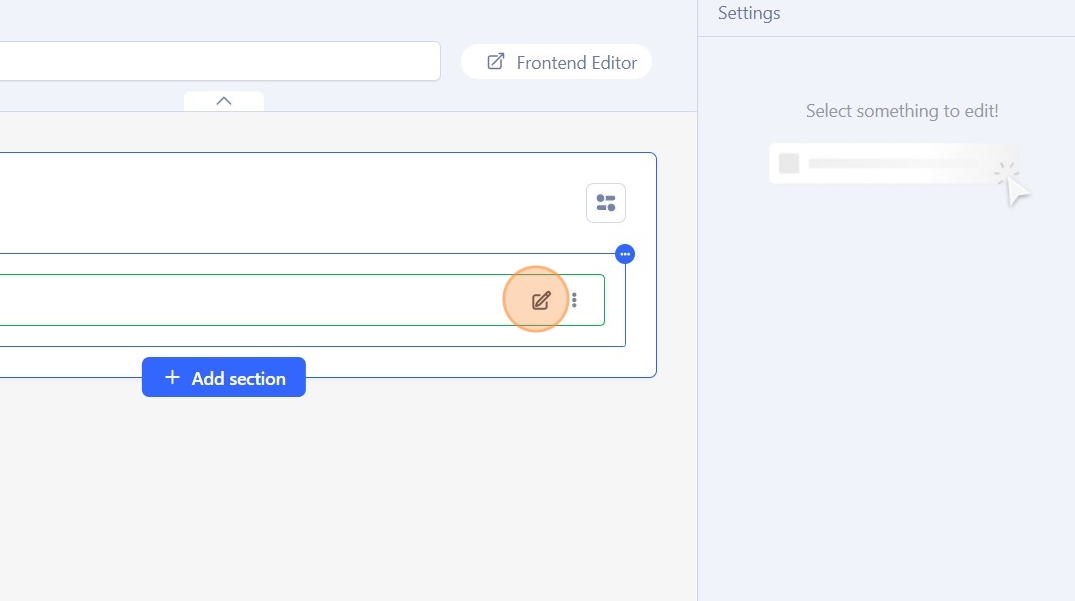
31. and then Click "Save"
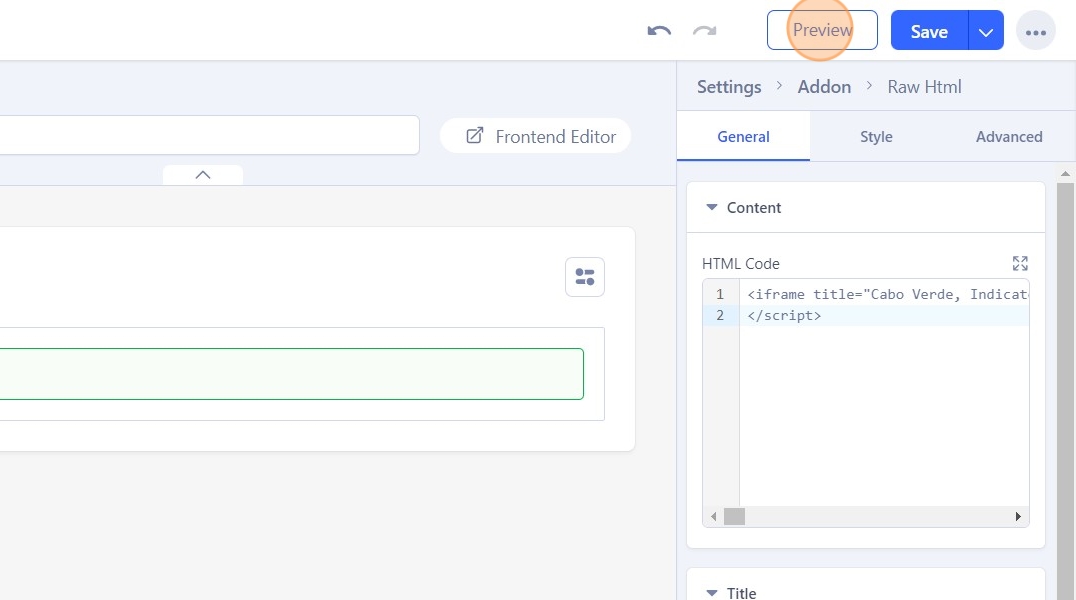
32. and then Click "Preview" to check the display of the visualisation
How to Modify Content on the Joomla Website
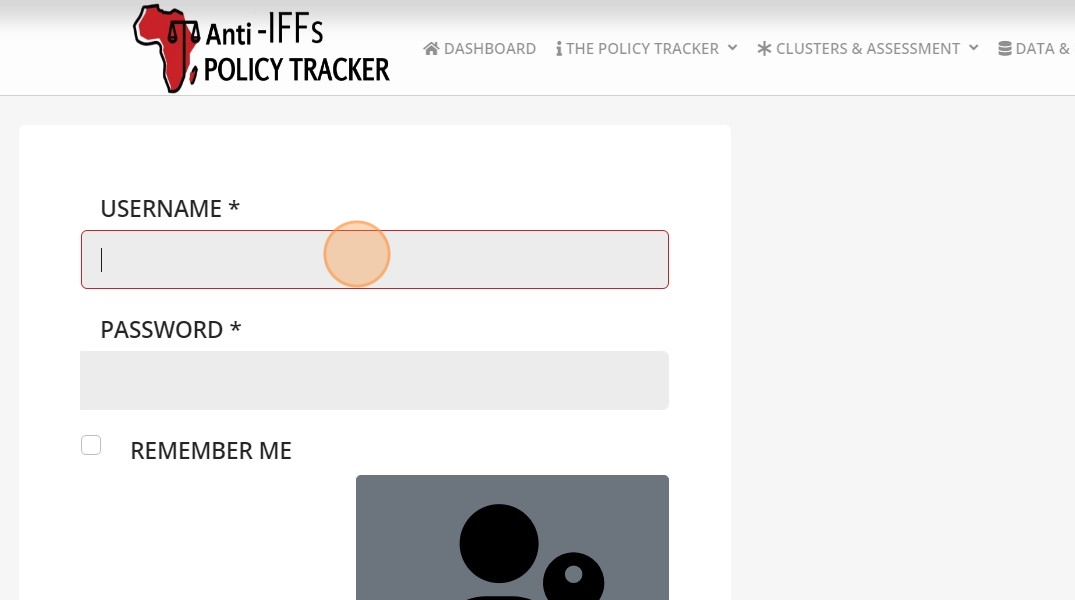
33. To modify the content on the Joomla website, go to www.ifftracker.africa, then click on "User Login."
34. Click "USER LOGIN"

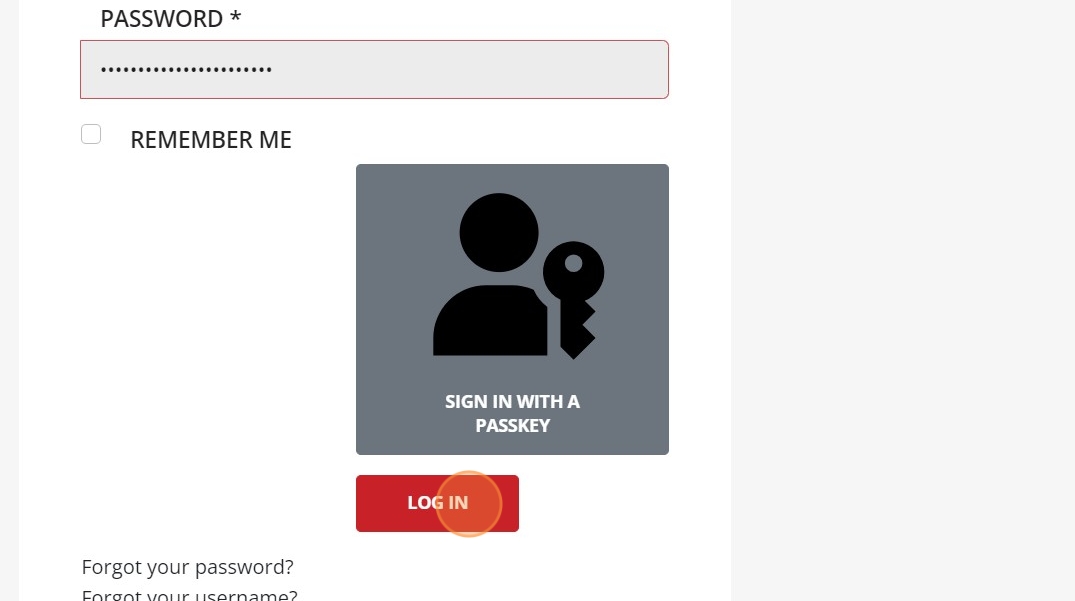
35. Then enter your credentials
36. and click on "Login."
37. Once logged in, on every page, there will be an "Edit Page" button
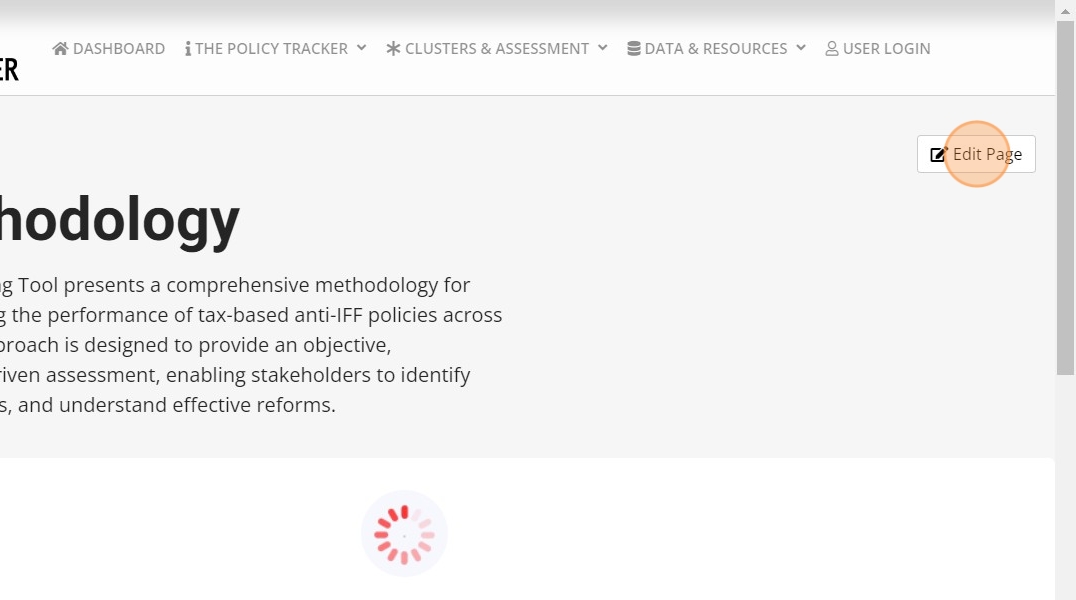
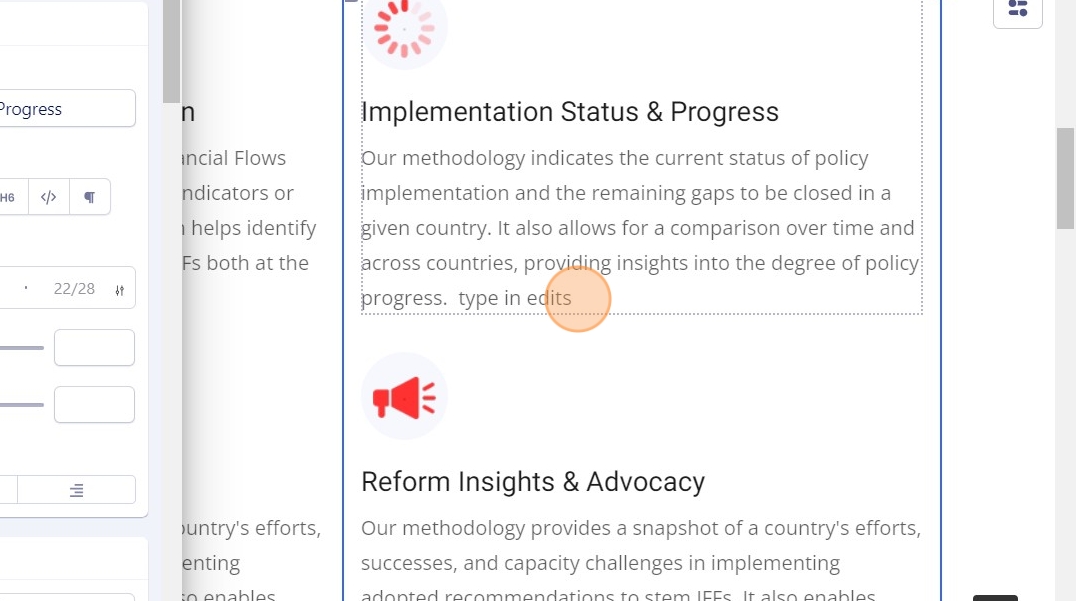
38. To edit the page, click on it, and the page editing interface will open, allowing you to make the necessary edits.
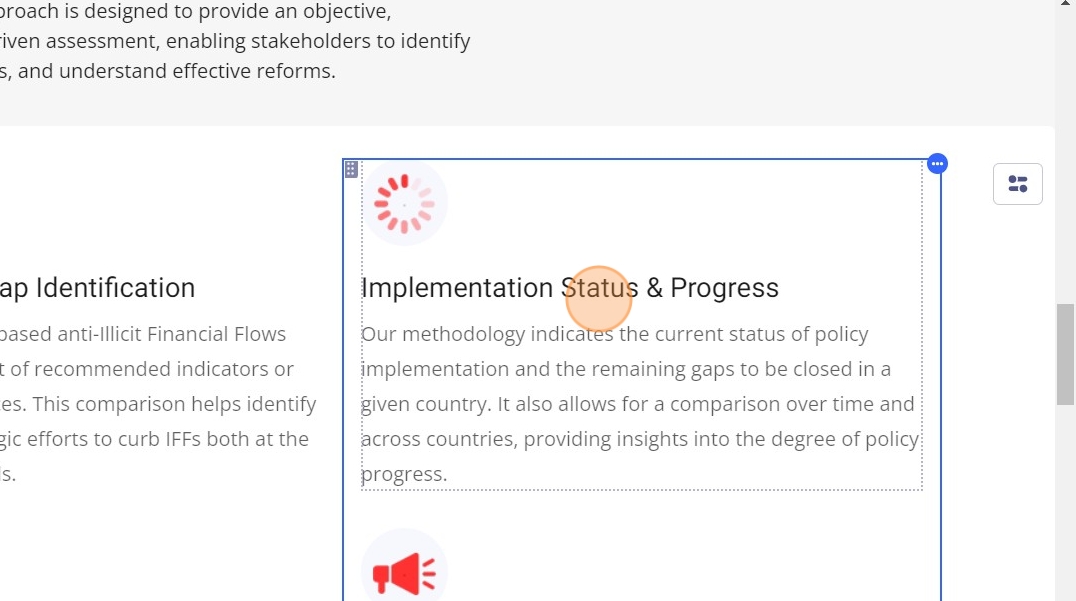
39. Click "Our methodology indicates the current status of policy implementation and the remaining gaps to be closed in a given country. It also allows for..."
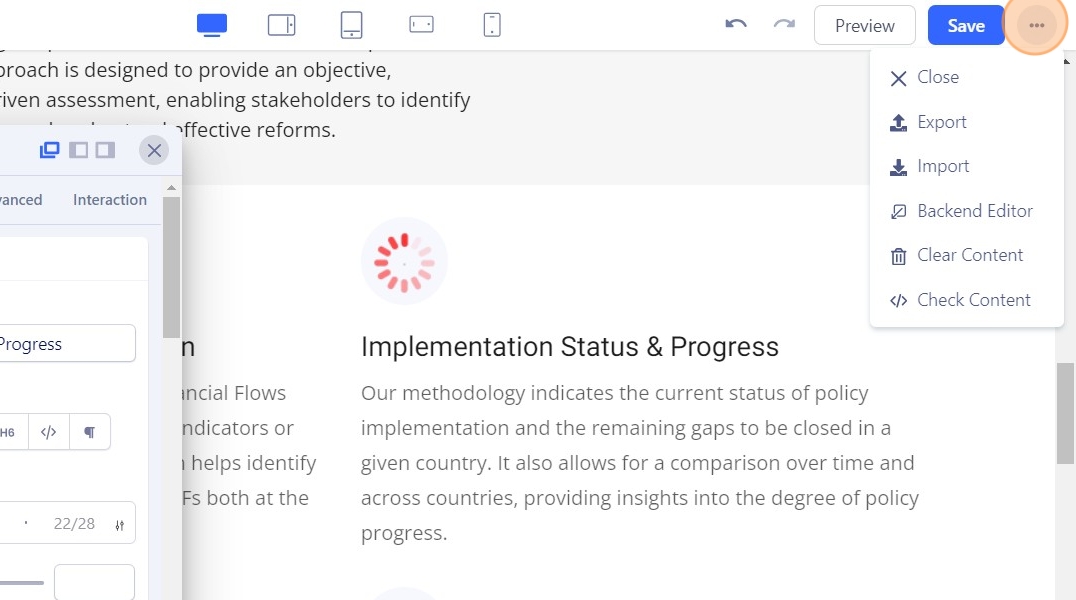
40. and then Click Save to save the edits and then close to close the edit page
Made with OpenEd